Pent-up Buyer Demand Drives January’s Resale Market
Uncategorized • February 8, 2021
Members of the Ottawa Real Estate Board sold 964 residential properties in January through the Board’s Multiple Listing Service® System, compared with 778 in January 2020, an increase of 24 per cent. January’s sales included 674 in the residential-property class, up 21 per cent from a year ago, and 290 in the condominium-property category, an increase of 31 per cent from January 2020. The five-year average for total unit sales in January is 786. 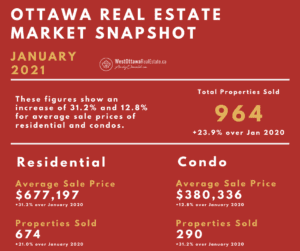
“Pent-up Buyer demand fueled the exceptional number of sales that took place in January even as the mid-month lockdown further restricted supply. Earlier in the month, listing activity increased, likely driven by those Sellers waiting until after the holiday season to put their properties on the market. However, once the Stay-at-Home Order was announced, Sellers pulled back (rightfully so) and the number of properties entering the market declined,” states Ottawa Real Estate Board President Debra Wright.
“Even though inventory is up from last month, it is still down substantially from last year at this time with 43% fewer properties on the market. This inventory shortage coupled with strong demand triggered a brisk pace to the market. We would have certainly seen higher sales numbers if there were more properties available because the demand is definitely there.”January’s average sale price for a condominium-class property was $380,336, an increase of 13 per cent from last year, while the average sale price of a residential-class property was $677,197, an increase of 31 per cent from a year ago. Compared to December, the average price for residential-class properties has increased by 12 per cent, and the average price for condominium-class units is 7 per cent higher.*
“I would like to caution those looking at the increase in average prices this month and believing that property values are accelerating at an extreme pace. In January, there was considerable movement in the upper end of the market, which caused a bit of an anomalous outcome in average price percentages. For example, there were 63 sales in the $1M+ price range, while last year at this time, there were only 16 transactions. Sustained price movements are better reflected during the mid to latter part of the year, where trends begin to emerge, and comparisons can be drawn,” advises Wright.
“This leads me into my next point – market activity has curtailed, there is no question about that, with January resale numbers lower than what we saw in December. But the effects of this second lockdown will not be entirely measurable until the coming months, dependent on when the mandated Stay-at-Home Order is retracted. If the lockdown is extended, that could affect the market in the longer term; however, as we saw last year, the market was resilient throughout and is being driven by the needs of Buyers and Sellers,” Wright concludes.
In addition to residential sales, OREB Members assisted clients with renting 333 properties in January 2021 compared with 243 in January 2020.
* The Board cautions that the average sale price can be useful in establishing trends over time but should not be used as an indicator that specific properties have increased or decreased in value. The calculation of the average sale price is based on the total dollar volume of all properties sold. Price and conditions will vary from neighbourhood to neighbourhood.